Visualizing
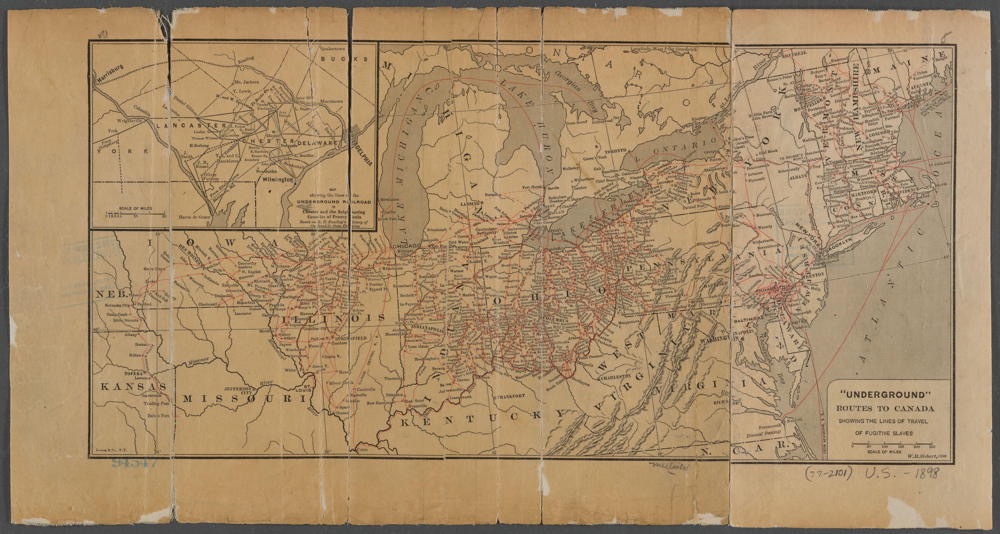
Wilbur Henry Siebert: "Underground" routes to Canada: showing the lines of travel of fugitive slaves (1898)
"Until then, I will be fueling renewed frustration."
"Trees" have become the traditional means for visually displaying a Fambly's history. They show the simple head-to-foot association of one generation to another as if each successive offspring stood on their parents' shoulders. These do not show geographical dispersion, but they aren't intended to. To display migratory paths, I must omit some information. Parent/child associations compete with physical locations to complicate any representation. Using layers, colors, and other graphic associations, I might produce a visualization too complicated for interpretation, so I must be extremely patient with myself.
One thread of my paternal grandmother's history involves the Bond into the Bounds line. I have yet to learn precisely why the surname morphed from Bond into Bonds and then into Bounds, but the timing suggests that it had something to do with a migration from London to a plantation in Virginia. It might have involved an attempt to distance from whatever caused the move, which appears to have been an indenture. Perhaps that indenture was something less than voluntary. The Bond family had been quite happily ensconced in the upper reaches of British society since at least 1250, the patriarch probably a Norman granted land following the Conquest. A succession of Sir Bonds followed into the 1530s when the Sir seems to have been dropped in that generation. A hundred years later, my ancestor, John Bounds, showed up in Virginia.
The British Isles part of the migration started in Cornwall before moving to Dorset, then to Northamptonshire, Leicestershire, Lancashire, North Wessex Downs, Surrey, London, and then Virginia over four hundred years. I spotted these points on a map, which brought this movement into spatial display. Suddenly, I could see where this history had taken place. Here's a link to that map. I can claim that this presentation represents a start. I can imagine additional layers to contain different converging threads since each point has at least two points before convergence. I have yet to resolve the difficulty caused by generations inhabiting more than one place. Some names appear in two descriptions, one representing their birthplace and the other for their death. Not every generation stayed in one place. Even given all these shortcomings, this Visualizing helps me imagine the flow of history converging at the physical end of the actual Oregon Trail.
Like with every attempted improvement, I can't shake the sense that I'm probably updating this map incorrectly. As far as I can tell, there's no antidote for this sense other than to update the map incorrectly and then go back and correct it. This process—called "learning"—seems awfully painstaking and patience-challenging. I'd much rather guess right the first time and dispatch the challenge in a single move, though history should have taught me by now that error, and often gross error, seems to be the way everything progresses. Our notions of efficiency only work after we've already messed up the first few iterations. If we want innovation, we must be prepared to absorb the tax levied on every variation. One day—not today, and probably not tomorrow—I will have mastered the finicky bits and satisfied myself with my migration maps. Until then, I will be fueling renewed frustration. Now, I wonder how I might add lines and arrows to represent migration.
©2024 by David A. Schmaltz - all rights reserved

Good For A Goose

Decency (90)
Decency Unscrolling (1)
EndDays (92)
Exiled (90)
Fambly (93)
FollowingChapters (93)
Grace (92)
Humor (2)
iAlogue (1)
Letters to the Editor (1)
NextWorld (91)
Personal (18)
Prosperity (42)
Steam Festival (4)
Unscrolling (89)
Vaporized (6)
Work (16)
July 2026
June 2026
May 2026
April 2026
March 2026
February 2026
January 2026
December 2025
November 2025
October 2025
September 2025
August 2025
July 2025
June 2025
May 2025
April 2025
March 2025
February 2025
January 2025
December 2024
November 2024
October 2024
September 2024
August 2024
July 2024
June 2024
May 2024
April 2024
March 2024
November 2006
October 2006
September 2006
August 2006
July 2006
June 2006
May 2006
April 2006
March 2006
February 2006
January 2006